Student Success Indicators

Using neighborhood data to collaborate for student success


Tulsa’s Child Equity Index

Tulsa leaders wanted a way to understand how conditions outside schools were influencing student success inside schools.

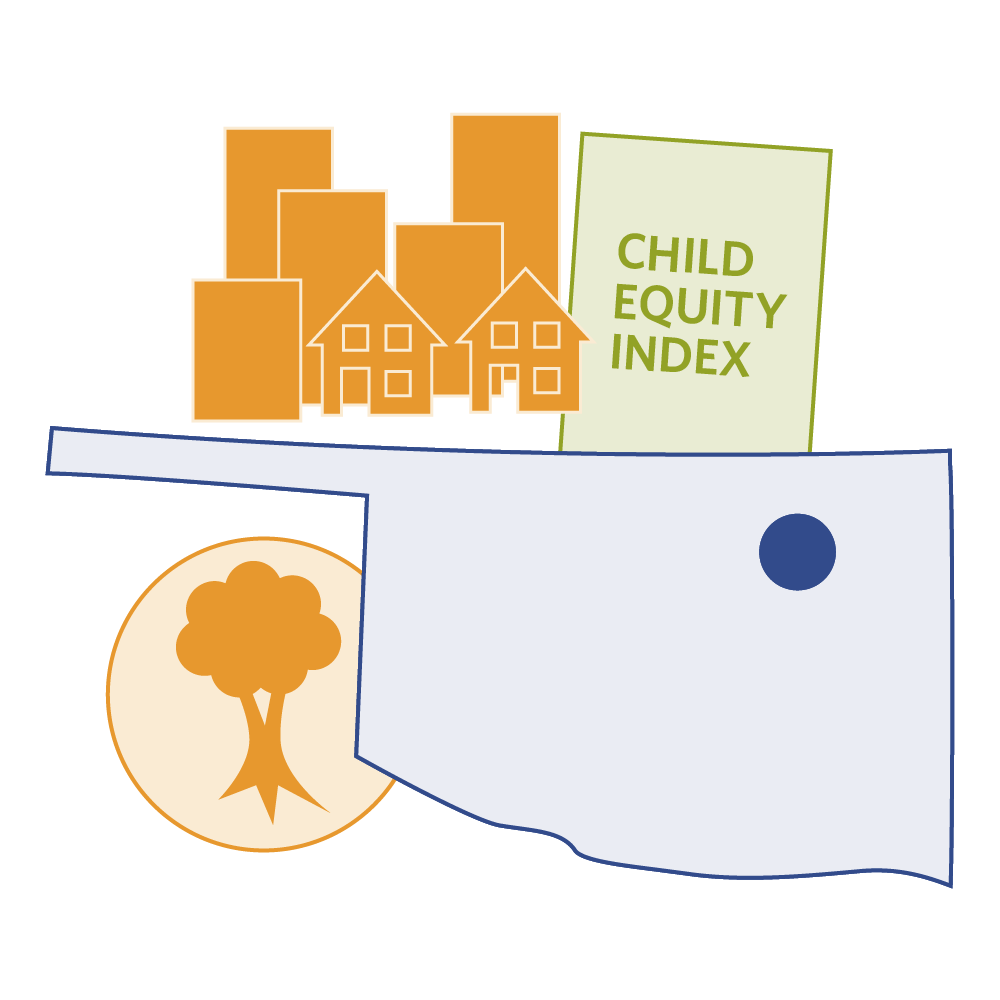
They were committed to addressing root causes of disparities and turning around historically poor student outcomes. The new tool they created in 2018, the Child Equity Index (CEI), aggregates data about neighborhood assets, challenges and resources to show the varying opportunities available to students in different schools.

The goal:

Measure and assess the conditions in the community that affect children’s likelihood to thrive. Use the data to design and implement interventions and redirect resources both inside and outside schools in ways that advance student learning.

Child Equity Index graphic

Watch a video about how education leaders are using these indicators in Tulsa.

Child Equity Index

Sample Indicators:

Neighborhood rates of homelessness, teen pregnancy, Supplemental Nutrition Assistance Program (SNAP) recipients, violent crimes, and public transit and vehicle access.

Measures:

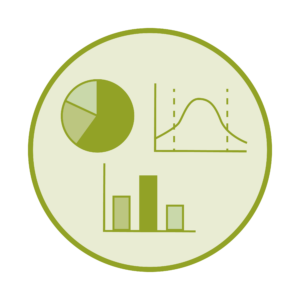
The context from community, neighborhood and family environments that influence a student’s opportunity to succeed academically.

The CEI measures how community and neighborhood conditions impact students’ likelihood to thrive

“Our goal was to create a tool that could be used to make data-informed, equity-based decisions at the school, district, neighborhood and city level about how to improve learning  conditions.”

— Delia Kimbrel, head of research and data strategy, ImpactTulsa

Beginning in 2018, a multisector team collaborated to develop the CEI tool over the course of a year. Tulsa Public Schools recruited the collective impact organization ImpactTulsa to facilitate a design process that included a wide range of leaders in education, government, business and the community. The index complements other more traditional data about school and student achievement, from kindergarten readiness to postsecondary completion, which Impact Tulsa also collects.

The CEI prioritizes six categories or “domains” that highlight if opportunities, conditions and resources are in place to help children to thrive. These domains aggregate 40 specific data points, including student demographics, community safety, violent crime, access to transportation, infant mortality, teen pregnancy, housing costs and food insecurity.

Using CEI’s spotlight on under-resourced school neighborhoods, the Tulsa community has redeployed resources. Shortly after CEI data began being published, City of Tulsa leaders used the information to inform how city agencies were working to help the district address challenges with chronic absenteeism. To target areas flagged by the CEI as having greater disparities, the city expanded its ride-for-free bus program to middle schoolers.

“Tulsa had few avenues for directly participating in conversations about improving educational achievement. The CEI gave us a clear metric for doing so.”

— Nick Doctor, former chief of community development and policy, City of Tulsa

Addressing historic patterns and racial disparities is hard work. In fall 2023, the Oklahoma state board of education approved re-accreditation of Tulsa Public Schools’, but with deficiencies. Some state leaders argued student achievement in Tulsa was not improving quickly enough, and some local leaders argued Tulsa was being unfairly targeted for political and racial reasons. Even in this highly charged environment, foundation, city and community leaders said they are committed to integrating CEI data into their decision-making.

The CEI provides valuable data to further equity. By highlighting neighborhoods with the greatest needs, the index continues to provide a venue for how agencies and nonprofits can prioritize partnerships with the district and individual schools to get students more of what they need to succeed.

“Data about school communities all in one place helped us begin brainstorming solutions to address the issues that we were seeing with students.”

— Omare Jimmerson, executive director, Tulsa Birth Equity Initiative

What is the Child Equity Index?

The CEI shows the relationship between the overall conditions in each of Tulsa’s neighborhoods alongside the academic outcomes of students who live there. Pulling together 40 indicators in six domains, the index connects academic outcomes to neighborhood census tract data and individual student-level characteristics. See below for example indicators, or see the entire list on ImpactTulsa’s Data Dashboard.

Six Domains

Where are students and schools most vulnerable?

Student demographics

Some measures include race, ethnicity, English language learners, mobility, attendance in pre-K, homelessness and suspensions.

Neighborhood health

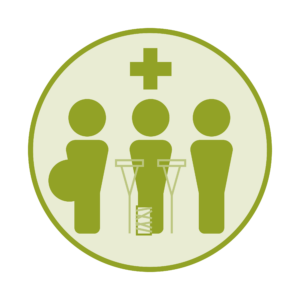
Some measures include community rates of life expectancy, infant mortality, teen pregnancy, emergency room visits, and mental health and substance abuse hospital visits.

graphic of house

Neighborhood socioeconomic status

Some measures include how much of the population is below the federal poverty level, unemployed, in low-quality housing or facing food insecurity.

Neighborhood safety

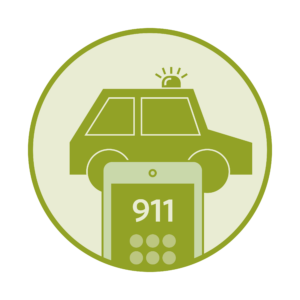
Some measures include arrests, violent and narcotic crime rates, and gun-related mortality.

Neighborhood custodianship

Some measures include non-emergency “311” phone calls about neighborhood issues and nuisance complaints.

Neighborhood access

Some measures include proximity to grocery stores, parks and schools, as well as transit and vehicle access.

“The CEI reflects multiple aspects of a child’s experience. Common standards are really important to understand the whole picture.”

— Sophia Pappas, managing director of birth through eight strategy for Tulsa, George Kaiser Family Foundation

What does the Child Equity Index measure?

The CEI shows the relationship between neighborhood health and student outcomes. Historical events and policies, such as the city’s 1921 race massacre and redlining in housing decisions, have contributed to historical disadvantages and inequities in community conditions today. These disparities are especially prominent in Black and Latino/a/x neighborhoods.

By aggregating a variety of neighborhood health measures, the CEI elevates uncomfortable realities. It shows how a variety of neighborhoods have benefited from different levels of public investment. The CEI is intended to support city, education and community leaders in identifying and addressing these gaps–removing disparities and creating stronger learning environments.

The CEI provides a systems view for understanding more root causes of education disparities. Mapping specialists and urban planners from the region’s planning agency helped bring the data to life with geocoded maps. Shaded areas in the map clearly show which places have more favorable conditions to support student outcomes, and which have less favorable ones.

View interactive CEI map

Map of Tulsa
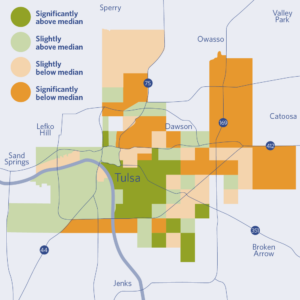
The green in the map represents neighborhoods that have more favorable contributions to student academic outcomes; the orange represents those that have less favorable contributions.

“To understand the root causes of disparities in outcomes, we need to consider, what are those opportunity gaps that lead to achievement gaps for students? The CEI showcases these issues.”

— Ritika Kurup, founder and principal Saahas LLC

How the Child Equity Index was developed

In 2018, Tulsa Public Schools initiated an effort to better understand community factors outside of school. The district asked ImpactTulsa, a collective action organization that uses data to align resources for a more equitable future for Tulsa-area children, to help develop what became the CEI tool.

“We wanted the CEI to be a galvanizing force, so city leaders and community organizations could use the information in partnership with the school system to strengthen youth development.”

— Paula Shannon, deputy superintendent, Tulsa Public Schools

ImpactTulsa led a collaborative, multisectoral process to identify indicators. With leaders from education, housing, health, public safety and neighborhood development, ImpactTulsa facilitated a series of workshops. First, they explored the biggest external influences and predictors of student outcomes. They then developed a comprehensive set of indicators to measure these factors and highlight disparities and inequities in every neighborhood.

They tested the indicators thoroughly. ImpactTulsa assessed each indicator to ensure it had a practical and statistically significant relationship to academic outcomes. It pulled data and statistics from the U.S. Census and American Community Survey, and it worked with Tulsa Public Schools, the Oklahoma Department of Education and the City of Tulsa to gain access to added data. Next, they facilitated six strategy action teams to further test the CEI tool. By 2019, the tool was ready to be launched and put into use.

Why this matters

Research shows that many out-of-school conditions also affect student outcomes. While data has long suggested the greatest in-school contributor to students’ success is the quality of their classroom teachers, there is clear need to address community conditions as well.

The CEI compiles information about these other conditions and unites them with school-by-school student data. In publishing the index, ImpactTulsa is not only helping the education leaders but the community understand the historical and current neighborhood conditions that are working for or against students.

“The CEI reinforces that the student outcomes we are seeing aren’t based on whether students can do well or what they know. The data help show that there’s much more involved in their learning than what we’re seeing on tests.”

— Melanie Poulter, research and data director, Tulsa Area United Way

The CEI brings the community together. Because it aggregates a wide range of data about neighborhood conditions, the CEI facilitates partnerships across sectors to build a stronger ecosystem of support for students..

“There are incredible opportunities for tools like the CEI to shine a light on the entire ecosystem and on the type of partnerships that need to exist across sectors to make a difference.”

— Paula Shannon, deputy superintendent, Tulsa Public Schools

Initial use of CEI has produced targeted interventions. As city and community leaders better understand what the index reports and what it suggests for how to engage more effectively, they have co-invested in new ways to support student learning.

What is innovative about the Child Equity Index?

The CEI aggregates data from different agencies to point community leaders to school neighborhoods with many risk factors. Education systems regularly measure gender, race and ethnicity, English learner status, and homelessness. City and regional agencies collect data on infant mortality rates, percentage of population below the federal poverty level, violent crime, and more. Some communities have also mapped out neighborhoods’ differential access to resources, such as parks and recreation, public transportation and grocery stores.

None of these data are hard to measure. What is hard is bringing data from multiple agencies and sources together and making sense of it.

“The greatest power of CEI data may be that it gives you the opportunity to view the world differently and to see and understand deficits and equity through a very different lens.”

— Jonathan McIlroy, director of data strategy, Tulsa Public Schools

CEI data helped the City of Tulsa and the Tulsa school district each identify new strategies to reduce chronic absenteeism. The CEI highlighted neighborhoods where safety and transportation access were affecting students’ attendance and creating barriers for them to get to school. With this information, the district adjusted bus routes to avoid areas higher in crime. The City of Tulsa improved sidewalks and expanded Tulsa Transit’s ride-for-free program to middle schoolers.

“Because of the CEI, we targeted our solutions, as opposed to painting with a broad brush. We knew immediately where to target our resources to be as equitable as possible.”

— Nick Doctor, former chief of community development and policy, City of Tulsa

An eviction data working group used the index to better support students facing unstable housing. CEI data revealed high concentrations of student absenteeism overlapping with neighborhoods with high housing evictions. A cross-sector working group developed an automated alert system for school counselors to identify students in families facing eviction and to help them work closely with those students to minimize disruptions to their learning.

The CEI proved useful in ensuring efforts to expand internet access early in the COVID-19 pandemic. At the pandemic’s onset, 15 percent of families with children in Tulsa lacked at-home internet access. Convened by ImpactTulsa and city leaders to take quick action on this challenge, the Tulsa Internet Access Taskforce used the CEI to understand where to target their efforts and develop strategies to boost connectivity so students could participate in remote learning.

“The CEI enables policymakers at Tulsa Public Schools to use neighborhood data to inform their decisions.”

— Jessica Shelton, founder, M+P Advocates

What can we learn to further the work?

Education First chose to profile the CEI because it uniquely compiles both in-school and out-of-school factors. In doing so, it provides both greater context about student outcomes and greater insights about the range of disparities affecting those outcomes. We found its spotlight on the quality of school neighborhoods—beyond only schools—distinctive.

As Tulsa and other communities interested in creating a CEI-like dashboard move forward, several issues need continued attention:

Build broad and durable buy-in and support. Student success indicators that spotlight the contexts influencing student learning are uncommon, thus all partners need to be committed to using an indicator like this and working together in its implementation. Because the CEI is a complex indicator that relies on multiple data sources, some partners also say they need more time and capacity to meet regularly, maintain data collection, and coordinate actions.

Aim for aligned actions between school system, city and community leaders. Concurrent with developing a tool such as the CEI, Tulsa leaders suggest plotting and discussing implementation strategies for how the data will be used and by whom. In Tulsa, for example, because a third-party nonprofit (ImpactTulsa) generates the CEI results for community leaders to use, it isn’t always clear which public agency is responsible for responding to disparities in the data spotlight.

“The CEI data is only as good as the capacity and willingness of institutions to act on it.”

— Ashley Philippsen, executive director, ImpactTulsa

Expect and address political dynamics. Context indicators, such as the CEI, look at conditions outside schools that influence learning and call into question how well other agencies and organizations are supporting student success. These measures spotlight historic inequalities and discrimination. Tulsa education leaders and the Oklahoma state superintendent of schools have been in conflict over the district’s performance, and it isn’t clear how the CEI’s focus on disparate community investments will be prioritized moving forward.

ImpactTulsa relies on the state department of education to share some of the data used in the index; this agreement could be in jeopardy as the state agency considers exercising new controls in the district.

“Every community organization should be turning to the CEI and thinking about how our policies and our investments directly benefit and improve the opportunities for students’ success.”

— Nick Doctor, former chief of community development and policy, City of Tulsa

Resources

Learn more about the CEI and how it measures out-of-school and in-school factors contributing to student outcomes:

To learn more about how the CEI has supported policy changes at the city and school district levels, read the following resources:


What’s next? Action steps to help you benefit from our expertise:

Work with us Gain insights Learn about our expertise